
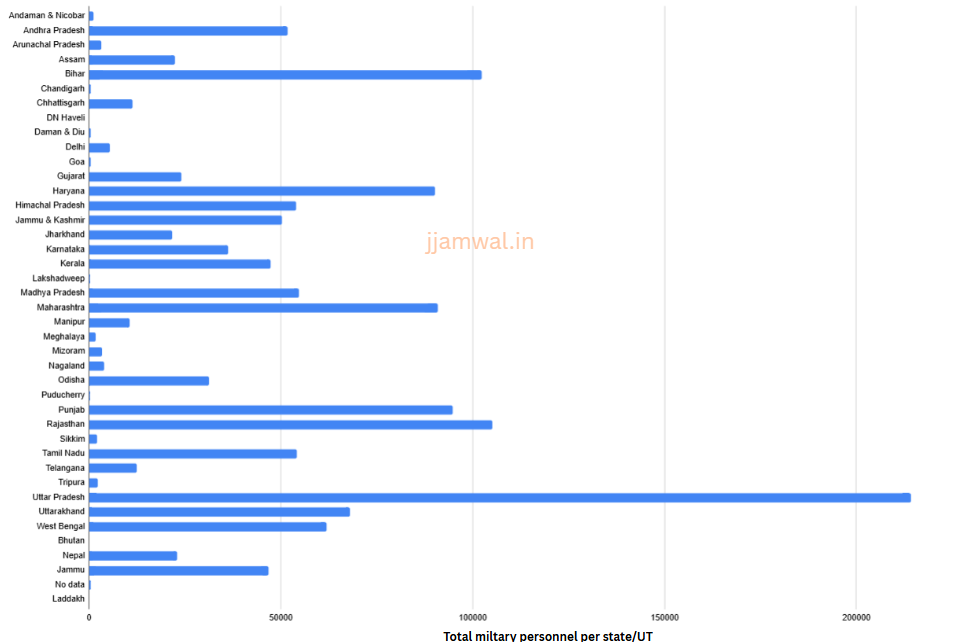
Indian armed forces bring together people from all corners of the country, but the level of participation isn’t the same everywhere. Looking at state-wise per capita representation helps us see recruitment patterns compared to their population size. It gives a clearer picture of how different states take part in the armed forces and can also show patterns in recruitment and local interest in military service.
For this post, I’ve taken data from a question answered in Indian parliament in April 2022. File linked at end of the post, if you want it. Population figures are of 2023 taken from Wikipedia. Due to obvious reasons, there will be some errors in exact per capita numbers. So they should be taken as general figures, not absolute.
For Jammu & Kashmir, I’ve calculated numbers of Jammu separately, assuming the population to be a bit less than that of Kashmir. A huge majority of uniformed personnel recruited from the state are from Jammu while contribution of muslim majority Kashmir is so small so as to be negligible.
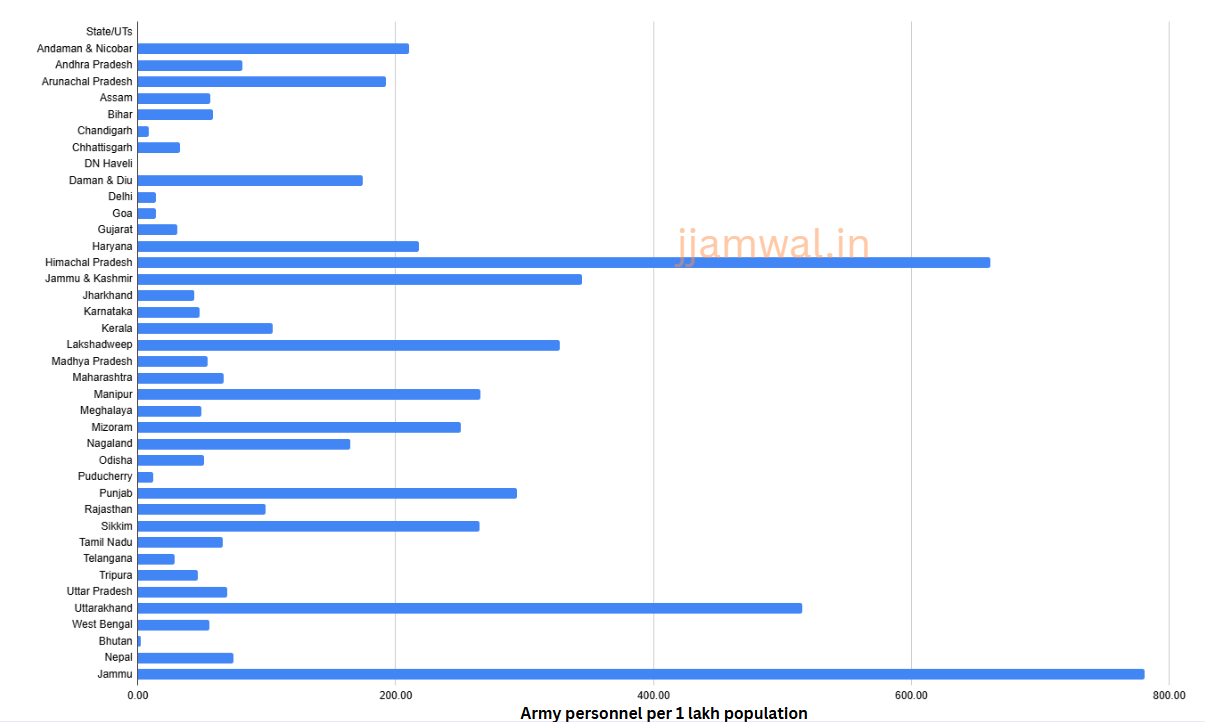
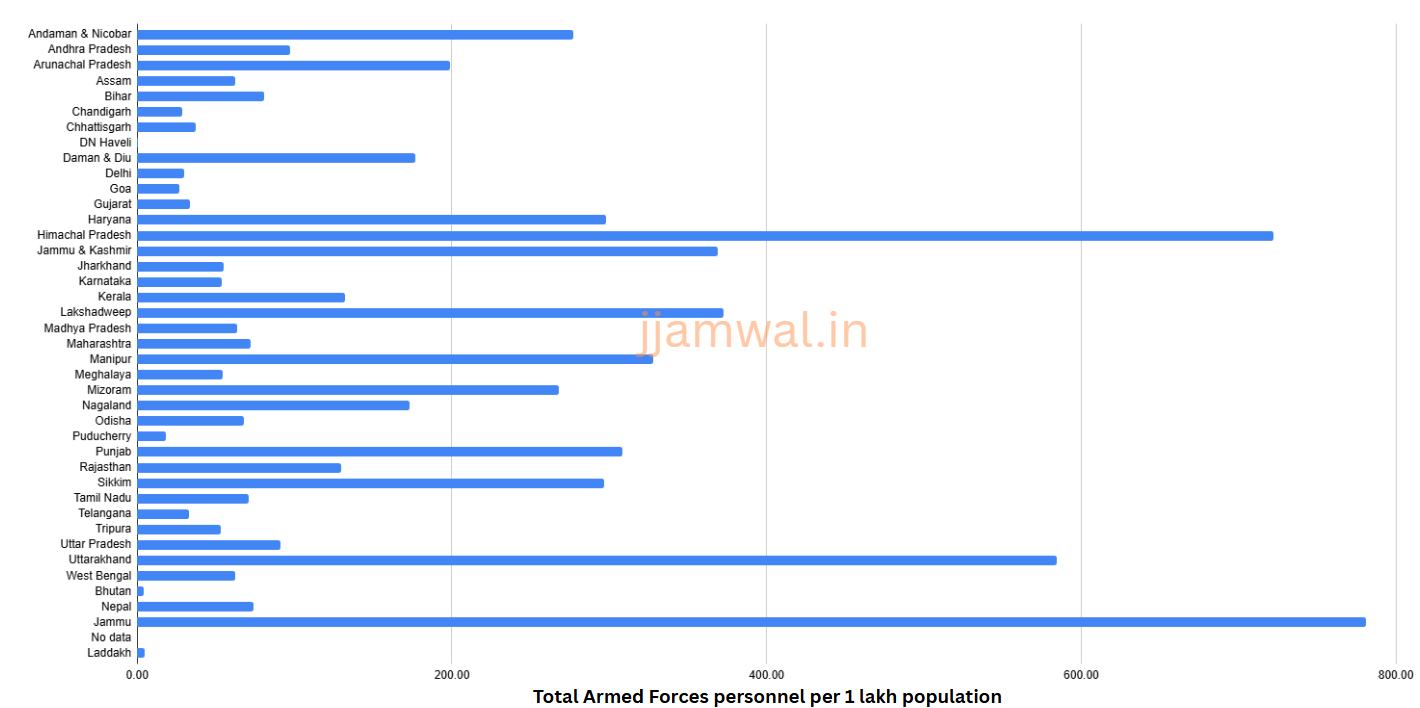
Overall, Jammu, Himachal Pradesh and Uttarakhand send most number of people per capita to Army as well as all 3 armed forces overall.
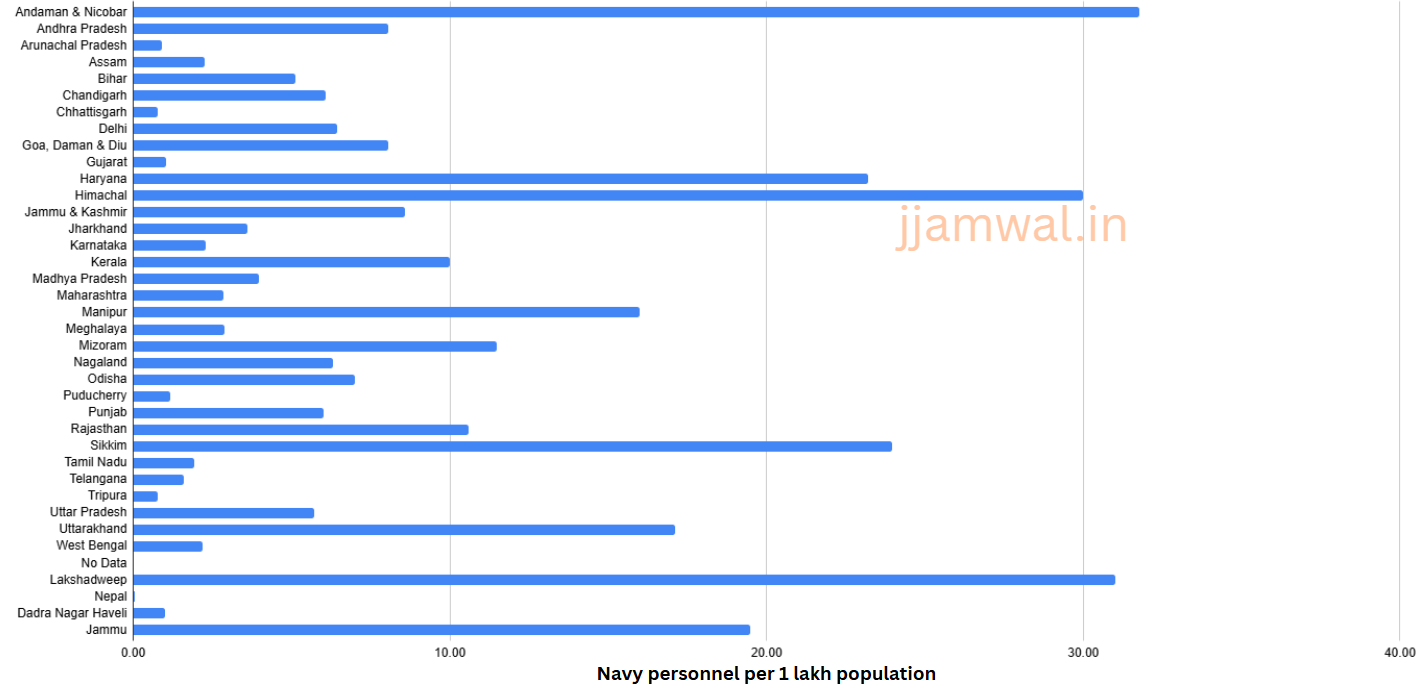
Andaman & Nicobar, Lakshadweep and Haryana send most people to Navy.
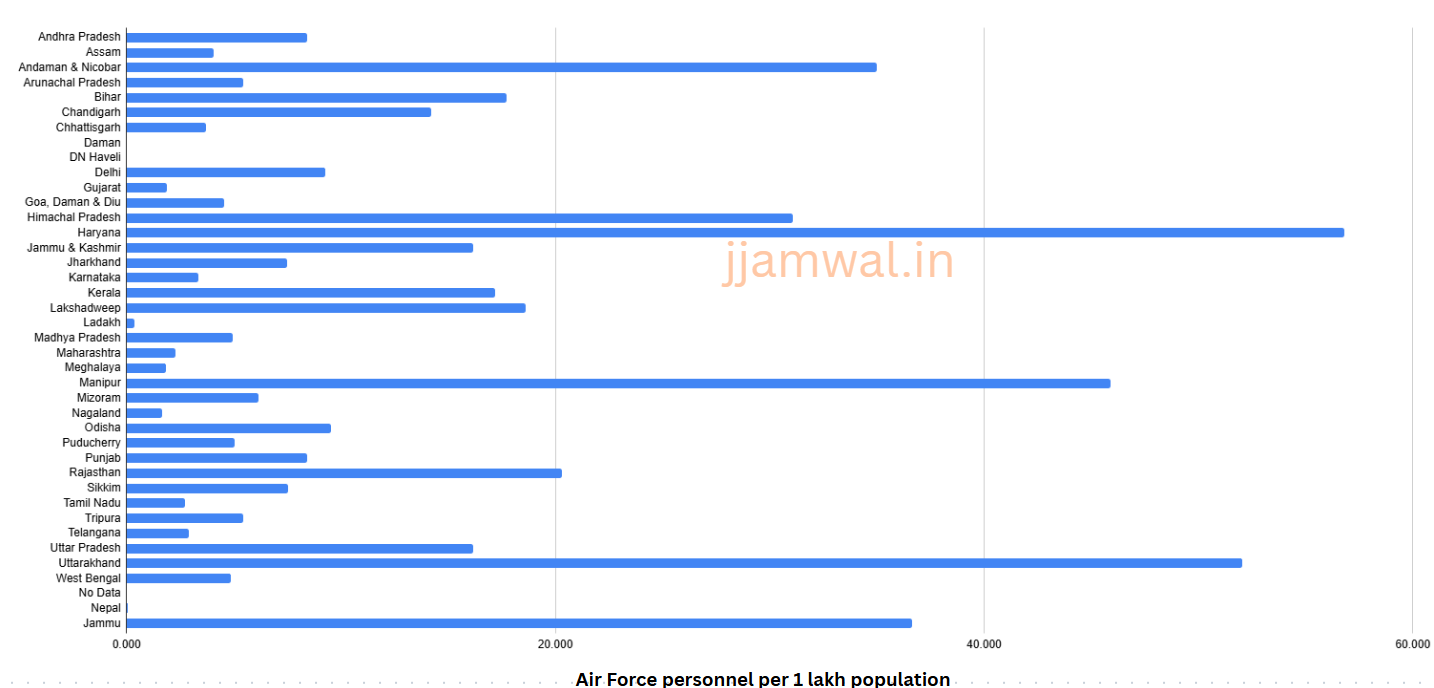
Haryana, Uttarakhand and Manipur send most to Air Force.
I had posted Indian Army’s recruitment figures by state in 2022, which you can check out on this link. If you find any errors, please leave a comment or contact me on twitter at https://x.com/JaidevJamwal.
NOTE: For Indian Army, data of only Junior Commissioned Officers (JCOs) and Other Ranks (ORs) is available, but not for the officers. So there may be some change in numbers when that dataset is included.
| State/UT | JCO | OR | Total | JCO | OR | Total | ||
| 1 | Andaman & Nicobar | 52 | 797 | 849 | 12.90 | 197.77 | 210.67 | |
| 2 | Andhra Pradesh | 3648 | 39278 | 42926 | 6.86 | 73.89 | 80.75 | |
| 3 | Arunachal Pradesh | 135 | 2871 | 3006 | 8.64 | 183.80 | 192.45 | |
| 4 | Assam | 1537 | 18515 | 20052 | 4.30 | 51.84 | 56.15 | |
| 5 | Bihar | 8152 | 65248 | 73400 | 6.43 | 51.48 | 57.91 | |
| 6 | Chandigarh | 26 | 79 | 105 | 2.11 | 6.42 | 8.53 | |
| 7 | Chhattisgarh | 466 | 9427 | 9893 | 1.54 | 31.24 | 32.78 | |
| 8 | DN Haveli | 0 | 1 | 1 | 0.00 | 0.08 | 0.08 | |
| 9 | Daman & Diu | 6 | 421 | 427 | 2.45 | 171.84 | 174.29 | |
| 10 | Delhi | 398 | 2116 | 2514 | 2.21 | 11.76 | 13.97 | |
| 11 | Goa | 15 | 204 | 219 | 0.95 | 12.95 | 13.90 | |
| 12 | Gujarat | 819 | 21214 | 22033 | 1.15 | 29.67 | 30.81 | |
| 13 | Haryana | 7803 | 58107 | 65910 | 25.83 | 192.35 | 218.18 | |
| 14 | Himachal Pradesh | 5948 | 43442 | 49390 | 79.65 | 581.71 | 661.36 | |
| 15 | Jammu & Kashmir | 4361 | 42494 | 46855 | 32.06 | 312.39 | 344.45 | |
| 16 | Jharkhand | 1274 | 15918 | 17192 | 3.23 | 40.33 | 43.56 | |
| 17 | Karnataka | 2268 | 30064 | 32332 | 3.35 | 44.41 | 47.76 | |
| 18 | Kerala | 4351 | 33180 | 37531 | 12.16 | 92.74 | 104.91 | |
| 19 | Lakshadweep | 1 | 228 | 229 | 1.43 | 325.71 | 327.14 | |
| 20 | Madhya Pradesh | 3350 | 43691 | 47041 | 3.87 | 50.46 | 54.33 | |
| 21 | Maharashtra | 6338 | 78035 | 84373 | 5.01 | 61.74 | 66.76 | |
| 22 | Manipur | 847 | 7718 | 8565 | 26.28 | 239.47 | 265.75 | |
| 23 | Meghalaya | 113 | 1538 | 1651 | 3.37 | 45.92 | 49.30 | |
| 24 | Mizoram | 157 | 2944 | 3101 | 12.68 | 237.80 | 250.48 | |
| 25 | Nagaland | 192 | 3489 | 3681 | 8.60 | 156.25 | 164.85 | |
| 26 | Odisha | 2945 | 20736 | 23681 | 6.36 | 44.81 | 51.17 | |
| 27 | Puducherry | 18 | 181 | 199 | 1.09 | 11.00 | 12.09 | |
| 28 | Punjab | 8158 | 82132 | 90290 | 26.55 | 267.27 | 293.82 | |
| 29 | Rajasthan | 8605 | 71429 | 80034 | 10.62 | 88.16 | 98.78 | |
| 30 | Sikkim | 44 | 1782 | 1826 | 6.39 | 258.64 | 265.02 | |
| 31 | Tamil Nadu | 5261 | 45396 | 50657 | 6.84 | 59.06 | 65.91 | |
| 32 | Telangana | 611 | 10187 | 10798 | 1.60 | 26.74 | 28.35 | |
| 33 | Tripura | 116 | 1818 | 1934 | 2.80 | 43.84 | 46.64 | |
| 34 | Uttar Pradesh | 18407 | 144317 | 162724 | 7.81 | 61.23 | 69.04 | |
| 35 | Uttarakhand | 7449 | 52529 | 59978 | 64.01 | 451.40 | 515.41 | |
| 36 | West Bengal | 5487 | 49384 | 54871 | 5.54 | 49.84 | 55.38 | |
| 37 | Bhutan | 1 | 13 | 14 | 0.14 | 1.79 | 1.93 | |
| 38 | Nepal | 2336 | 20654 | 22990 | 7.51 | 66.37 | 73.88 | |
| 39 | Jammu | 4361 | 42494 | 46855 | 72.68 | 708.23 | 780.92 |
| PER 1 LAKH | ||||||||
| OFFICERS | SAILORS | TOTAL | OFFICERS | SAILORS | TOTAL | |||
| 1 | Andaman & Nicobar | 16 | 112 | 128 | 3.97 | 27.79 | 31.76 | |
| 2 | Andhra Pradesh | 601 | 3677 | 4278 | 11.31 | 69.17 | 8.05 | |
| 3 | Arunachal Pradesh | 5 | 9 | 14 | 3.20 | 5.76 | 0.90 | |
| 4 | Assam | 42 | 763 | 805 | 1.18 | 21.36 | 2.25 | |
| 5 | Bihar | 540 | 5964 | 6504 | 4.26 | 47.05 | 5.13 | |
| 6 | Chandigarh | 54 | 21 | 75 | 43.87 | 17.06 | 6.09 | |
| 7 | Chhattisgarh | 49 | 187 | 236 | 1.62 | 6.20 | 0.78 | |
| 8 | Delhi | 534 | 627 | 1161 | 29.67 | 34.83 | 6.45 | |
| 9 | Goa, Daman & Diu | 35 | 92 | 127 | 22.22 | 58.41 | 8.06 | |
| 10 | Gujarat | 80 | 652 | 732 | 1.12 | 9.12 | 1.02 | |
| 11 | Haryana | 776 | 6237 | 7013 | 25.69 | 206.46 | 23.21 | |
| 12 | Himachal | 303 | 1937 | 2240 | 40.57 | 259.37 | 29.99 | |
| 13 | Jammu | 144 | 1024 | 1168 | 10.59 | 75.28 | 8.59 | |
| 14 | Jharkhand | 116 | 1311 | 1427 | 2.94 | 33.22 | 3.62 | |
| 15 | Karnataka | 502 | 1052 | 1554 | 7.42 | 15.54 | 2.30 | |
| 16 | Kerala | 1033 | 2542 | 3575 | 28.87 | 71.05 | 9.99 | |
| 17 | Madhya Pradesh | 393 | 3043 | 3436 | 4.54 | 35.15 | 3.97 | |
| 18 | Maharashtra | 745 | 2854 | 3599 | 5.89 | 22.58 | 2.85 | |
| 19 | Manipur | 56 | 459 | 515 | 17.38 | 142.41 | 15.98 | |
| 20 | Meghalaya | 9 | 88 | 97 | 2.69 | 26.28 | 2.90 | |
| 21 | Mizoram | 1 | 141 | 142 | 0.81 | 113.89 | 11.47 | |
| 22 | Nagaland | 2 | 139 | 141 | 0.90 | 62.25 | 6.31 | |
| 23 | Odisha | 240 | 3006 | 3246 | 5.19 | 64.96 | 7.01 | |
| 24 | Puducherry | 13 | 6 | 19 | 7.90 | 3.65 | 1.15 | |
| 25 | Punjab | 381 | 1464 | 1845 | 12.40 | 47.64 | 6.00 | |
| 26 | Rajasthan | 374 | 8202 | 8576 | 4.62 | 101.23 | 10.58 | |
| 27 | Sikkim | 3 | 162 | 165 | 4.35 | 235.12 | 23.95 | |
| 28 | Tamil Nadu | 579 | 912 | 1491 | 7.53 | 11.87 | 1.94 | |
| 29 | Telangana | 37 | 574 | 611 | 0.97 | 15.07 | 1.60 | |
| 30 | Tripura | 8 | 24 | 32 | 1.93 | 5.79 | 0.77 | |
| 31 | Uttar Pradesh | 1486 | 11946 | 13432 | 6.30 | 50.69 | 5.70 | |
| 32 | Uttarakhand | 413 | 1578 | 1991 | 35.49 | 135.60 | 17.11 | |
| 33 | West Bengal | 277 | 1888 | 2165 | 2.80 | 19.05 | 2.19 | |
| 34 | No Data | 322 | 322 | #DIV/0! | #DIV/0! | #DIV/0! | ||
| 35 | Lakshadweep | 20 | 20 | 0.00 | 310.21 | 31.02 | ||
| 36 | Nepal | 12 | 12 | 0.00 | 0.39 | 0.04 | ||
| 37 | Dadra Nagar Haveli | 4 | 4 | 0.00 | 9.93 | 0.99 | ||
| 38 | Jammu | 144 | 1024 | 1168 | 24.00 | 170.67 | 19.47 | |
| PER 1 LAKH | ||||||||
| OFFICERS | AIRMEN | TOTAL | OFFICERS | AIRMEN | TOTAL | |||
| 1 | Andhra Pradesh | 525 | 3963 | 4488 | 0.988 | 7.455 | 8.443 | |
| 2 | Assam | 69 | 1386 | 1455 | 0.193 | 3.881 | 4.074 | |
| 3 | Andaman & Nicobar | 6 | 135 | 141 | 1.489 | 33.499 | 34.988 | |
| 4 | Arunachal Pradesh | 3 | 82 | 85 | 0.192 | 5.250 | 5.442 | |
| 5 | Bihar | 540 | 21931 | 22471 | 0.426 | 17.302 | 17.728 | |
| 6 | Chandigarh | 104 | 71 | 175 | 8.448 | 5.768 | 14.216 | |
| 7 | Chhattisgarh | 84 | 1032 | 1116 | 0.278 | 3.419 | 3.698 | |
| 8 | Daman | 2 | 4 | 6 | #DIV/0! | #DIV/0! | #DIV/0! | |
| 9 | DN Haveli | 0 | 0.000 | 0.000 | 0.000 | |||
| 10 | Delhi | 729 | 944 | 1673 | 4.050 | 5.244 | 9.294 | |
| 11 | Gujarat | 147 | 1216 | 1363 | 0.206 | 1.701 | 1.906 | |
| 12 | Goa, Daman & Diu | 29 | 43 | 72 | #REF! | #REF! | #REF! | |
| 13 | Himachal Pradesh | 327 | 1994 | 2321 | 4.379 | 26.701 | 31.079 | |
| 14 | Haryana | 1137 | 16024 | 17161 | 3.764 | 53.044 | 56.808 | |
| 15 | Jammu & Kashmir | 215 | 1983 | 2198 | 1.581 | 14.578 | 16.158 | |
| 16 | Jharkhand | 176 | 2788 | 2964 | 0.446 | 7.064 | 7.510 | |
| 17 | Karnataka | 581 | 1692 | 2273 | 0.858 | 2.500 | 3.358 | |
| 18 | Kerala | 749 | 5404 | 6153 | 2.094 | 15.105 | 17.199 | |
| 19 | Lakshadweep | 12 | 12 | 0.000 | 18.612 | 18.612 | ||
| 20 | Ladakh | 13 | 13 | 0.000 | 0.388 | 0.388 | ||
| 21 | Madhya Pradesh | 522 | 3758 | 4280 | 0.603 | 4.341 | 4.943 | |
| 22 | Maharashtra | 824 | 2086 | 2910 | 0.652 | 1.651 | 2.302 | |
| 23 | Meghalaya | 8 | 53 | 61 | 0.239 | 1.583 | 1.821 | |
| 24 | Manipur | 63 | 1417 | 1480 | 1.955 | 43.965 | 45.920 | |
| 25 | Mizoram | 5 | 71 | 76 | 0.404 | 5.735 | 6.139 | |
| 26 | Nagaland | 6 | 31 | 37 | 0.269 | 1.388 | 1.657 | |
| 27 | Odisha | 225 | 4194 | 4419 | 0.486 | 9.063 | 9.549 | |
| 28 | Puducherry | 22 | 61 | 83 | 1.337 | 3.706 | 5.043 | |
| 29 | Punjab | 664 | 1924 | 2588 | 2.161 | 6.261 | 8.422 | |
| 30 | Rajasthan | 572 | 15868 | 16440 | 0.706 | 19.584 | 20.290 | |
| 31 | Sikkim | 7 | 45 | 52 | 1.016 | 6.531 | 7.547 | |
| 32 | Tamil Nadu | 624 | 1475 | 2099 | 0.812 | 1.919 | 2.731 | |
| 33 | Tripura | 10 | 216 | 226 | 0.241 | 5.209 | 5.450 | |
| 34 | Telangana | 55 | 1049 | 1104 | 0.144 | 2.754 | 2.898 | |
| 35 | Uttar Pradesh | 2134 | 35942 | 38076 | 0.905 | 15.250 | 16.155 | |
| 36 | Uttarakhand | 632 | 5425 | 6057 | 5.431 | 46.619 | 52.049 | |
| 37 | West Bengal | 299 | 4538 | 4837 | 0.302 | 4.580 | 4.882 | |
| 38 | Under verification | 48 | 48 | #DIV/0! | #DIV/0! | #DIV/0! | ||
| 39 | Nepal | 18 | 18 | 0.000 | 0.058 | 0.058 | ||
| 40 | Jammu | 215 | 1983 | 2198 | 3.583 | 33.050 | 36.633 | |
| STATE/UT | TOTAL | POPULATION | PER 1 LAKH | ||
| 1 | Andaman & Nicobar | 1118 | 403,000 | 277.42 | |
| 2 | Andhra Pradesh | 51692 | 53156000 | 97.25 | |
| 3 | Arunachal Pradesh | 3105 | 1562000 | 198.78 | |
| 4 | Assam | 22312 | 35713000 | 62.48 | |
| 5 | Bihar | 102375 | 126756000 | 80.77 | |
| 6 | Chandigarh | 355 | 1231000 | 28.84 | |
| 7 | Chhattisgarh | 11245 | 30180000 | 37.26 | |
| 8 | DN Haveli | 5 | 1263000 | 0.40 | |
| 9 | Daman & Diu | 433 | 245000 | 176.73 | |
| 10 | Delhi | 5348 | 18000000 | 29.71 | |
| 11 | Goa | 418 | 1575000 | 26.54 | |
| 12 | Gujarat | 24128 | 71507000 | 33.74 | |
| 13 | Haryana | 90084 | 30209000 | 298.20 | |
| 14 | Himachal Pradesh | 53951 | 7468000 | 722.43 | |
| 15 | Jammu & Kashmir | 50221 | 13603000 | 369.19 | |
| 16 | Jharkhand | 21583 | 39466000 | 54.69 | |
| 17 | Karnataka | 36159 | 67692000 | 53.42 | |
| 18 | Kerala | 47259 | 35776000 | 132.10 | |
| 19 | Lakshadweep | 261 | 70000 | 372.86 | |
| 20 | Madhya Pradesh | 54757 | 86579000 | 63.25 | |
| 21 | Maharashtra | 90882 | 126385000 | 71.91 | |
| 22 | Manipur | 10560 | 3223000 | 327.65 | |
| 23 | Meghalaya | 1809 | 3349000 | 54.02 | |
| 24 | Mizoram | 3319 | 1238000 | 268.09 | |
| 25 | Nagaland | 3859 | 2233000 | 172.82 | |
| 26 | Odisha | 31346 | 46276000 | 67.74 | |
| 27 | Puducherry | 301 | 1646000 | 18.29 | |
| 28 | Punjab | 94723 | 30730000 | 308.24 | |
| 29 | Rajasthan | 105050 | 81025000 | 129.65 | |
| 30 | Sikkim | 2043 | 689000 | 296.52 | |
| 31 | Tamil Nadu | 54247 | 76860000 | 70.58 | |
| 32 | Telangana | 12513 | 38090000 | 32.85 | |
| 33 | Tripura | 2192 | 4147000 | 52.86 | |
| 34 | Uttar Pradesh | 214232 | 235687000 | 90.90 | |
| 35 | Uttarakhand | 68026 | 11637000 | 584.57 | |
| 36 | West Bengal | 61873 | 99084000 | 62.44 | |
| 37 | Bhutan | 32 | 727,000 | 4.40 | |
| 38 | Nepal | 23002 | 31,120,000 | 73.91 | |
| 39 | Jammu | 46855 | 6,000,000 | 780.92 | |
| 40 | No data | 370 | #DIV/0! | ||
| 41 | Laddakh | 13 | 274,289 | 4.74 |
| STATE/UT | POPULATION |
| Andaman & Nicobar | 403,000 |
| Andhra Pradesh | 53156000 |
| Arunachal Pradesh | 1562000 |
| Assam | 35713000 |
| Bihar | 126756000 |
| Chandigarh | 1231000 |
| Chhattisgarh | 30180000 |
| Dadar & Nagar Haveli | 1263000 |
| Daman & Diu | 245000 |
| Delhi | 18000000 |
| Goa | 1575000 |
| Gujarat | 71507000 |
| Haryana | 30209000 |
| Himachal Pradesh | 7468000 |
| Jammu | 13603000 |
| Jharkhand | 39466000 |
| Karnataka | 67692000 |
| Kerala | 35776000 |
| Lakshadweep | 70000 |
| Madhya Pradesh | 86579000 |
| Maharashtra | 126385000 |
| Manipur | 3223000 |
| Meghalaya | 3349000 |
| Mizoram | 1238000 |
| Nagaland | 2233000 |
| Odisha | 46276000 |
| Puducherry | 1646000 |
| Punjab | 30730000 |
| Rajasthan | 81025000 |
| Sikkim | 689000 |
| Tamil Nadu | 76860000 |
| Telangana | 38090000 |
| Tripura | 4147000 |
| Uttar Pradesh | 235687000 |
| Uttarakhand | 11637000 |
| West Bengal | 99084000 |
| Bhutan | 727,000 |
| Nepal | 31,120,000 |
| Jammu | 6,000,000 |
| Laddakh | 274,289 |
Leave a Reply