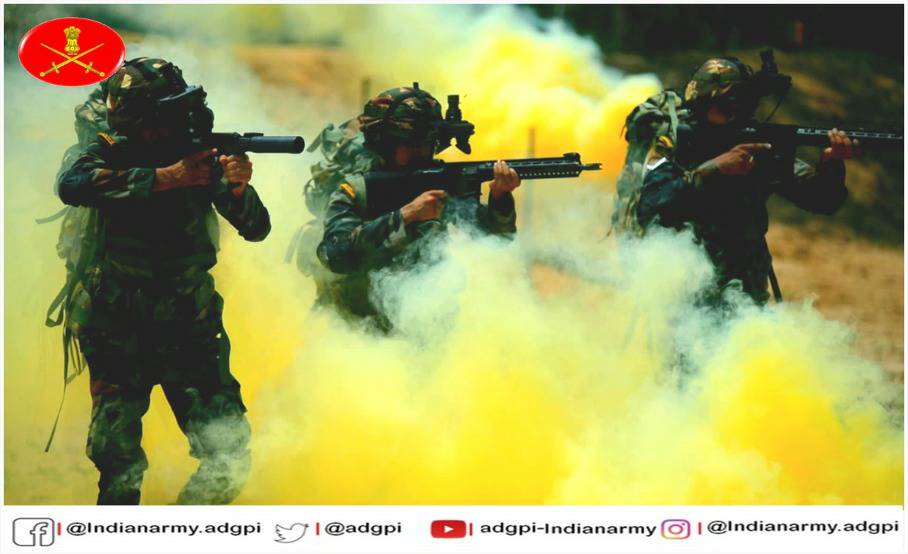
I was curious about number of soldiers per capita recruited from Indian states, so wrote this post. One issue was getting accurate population statistics for different states, so the per capita recruitment numbers are just for 2018-19. Looking at the figures below, following observations can be made.
If you go by per capita numbers, Himachal Pradesh is on top with 612 annual recruitments per 10 lakh population. Next is Sikkim with 372 and Uttarakhand with 319. Only other region that comes close is Jammu which sends 686*. I’ve put in Jammu different from Kashmir, as latter barely sends any soldiers. Even the muslim soldiers from state are almost always from Jammu. So top five states in India for annual recruitment of army men per 10 lakh population are:
- Himachal Pradesh: 612
- Sikkim: 372
- Uttarakhand: 319
- Jammu & Kashmir: 299 (686 if only Jammu* is considered)
- Mizoram: 167
* If Laddakh is included in the numbers, then per capita numbers of Jammu will be around 550. Exact data is unavailable.
If you go by sheer numbers, then Uttar Pradesh sends highest number of men per year to army, 6322, followed by Punjab (including Chandigarh) with 5846 and Rajasthan at 4172. Nepal is an interesting source which sent 2502 people in Indian army in 2018-19, making it’s per-capita number 83, higher than many Indian states like West Bengal and all of South India.
Additionally, there is a lot of fake information on social media like the graphic below which claims that Sikhs form between 15 to 50% of Indian army. Sikhs are nearly 57% of Punjab’s population and Hindus are 38%. Going by this figure and assuming that representation in army is proportional for both communities, number of Punjabi Sikhs in army annually should be around 3340. Punjab numbers also include Chandigarh which has a sizeable Haryanavi population. So all such posts have grossly exaggerated the numbers for fake propaganda.
| No. | Name of States & UTs | Recruitments Per Year | Population | Soldiers/10 lakh | |||
| 2016-17 | 2017-18 | 2018-19 | |||||
| 1 | Andhra Pradesh | 1389 | 1431 | 1301 | 49,577,103 | 26.24195286 | |
| 2 | Telangana | 515 | 643 | 693 | 35,003,674 | 19.79792178 | |
| 3 | Tamil Nadu, A&N Islands & Puducherry | 1886 | 1875 | 1539 | 72,147,030 | 21.33143942 | |
| 4 | Arunachal Pradesh | 156 | 217 | 195 | 1,383,727 | 140.9237516 | |
| 5 | Assam | 829 | 900 | 631 | 31,205,576 | 20.22074516 | |
| 6 | Bihar | 2932 | 2726 | 2199 | 104,099,452 | 21.12403051 | |
| 7 | Chattisgarh | 817 | 606 | 372 | 25,545,198 | 14.56242383 | |
| 8 | Delhi | 798 | 166 | 167 | 16,787,941 | 9.947616566 | |
| 9 | Goa | 16 | 1 | 2 | 1,458,545 | 1.371229547 | |
| 10 | Gujarat Incl Dadar Nagar Haveli & Daman & Diu | 1257 | 728 | 1346 | 60,439,692 | 22.27013334 | |
| 11 | Haryana | 3538 | 3634 | 3210 | 25,351,462 | 126.6199164 | |
| 12 | Himachal Pradesh | 2174 | 2376 | 4202 | 6,864,602 | 612.1258013 | |
| 13 | Jammu & Kashmir | 1954 | 1817 | 3672 | 12,267,032 | 299.338911 | |
| 13-1 | Jammu | 3672 | 5,350,811 | 686.2511122 | |||
| 14 | Jharkhand | 687 | 925 | 663 | 32,988,134 | 20.09813589 | |
| 15 | Karnataka incl Lakshdweep | 1157 | 1417 | 1693 | 61,095,297 | 27.71080727 | |
| 16 | Kerala | 1584 | 1278 | 865 | 33,406,061 | 25.89350477 | |
| 17 | Madhya Pradesh | 2281 | 2352 | 1570 | 72,626,809 | 21.61736171 | |
| 18 | Maharashtra | 3980 | 3836 | 4050 | 112,374,333 | 36.04025841 | |
| 19 | Manipur | 247 | 400 | 311 | 2,570,390 | 120.9933123 | |
| 20 | Meghalaya | 86 | 75 | 89 | 2,966,889 | 29.99775185 | |
| 21 | Mizoram | 200 | 108 | 184 | 1,097,206 | 167.6986819 | |
| 22 | Nagaland | 112 | 103 | 122 | 1,978,502 | 61.66281358 | |
| 23 | Odissa | 642 | 737 | 474 | 41,974,219 | 11.29264609 | |
| 24 | Punjab incl Chandigarh | 4618 | 4991 | 5846 | 35,743,338 | 163.5549539 | |
| 25 | Rajasthan | 4658 | 4298 | 4172 | 68,548,437 | 60.86207334 | |
| 26 | Sikkim | 39 | 109 | 227 | 610,577 | 371.7794807 | |
| 27 | Tripura | 89 | 55 | 69 | 3,673,917 | 18.78104486 | |
| 28 | Uttar Pradesh | 6245 | 6339 | 6322 | 199,812,341 | 31.63968736 | |
| 29 | Uttrakhand | 3360 | 2384 | 3222 | 10,086,292 | 319.4434585 | |
| 30 | West Bengal | 2116 | 1862 | 1471 | 91,276,115 | 16.1159357 | |
| 31 | Nepal | 1724 | 1049 | 2502 | 30000000 | 83.4 |
- Recruitment Numbers: Indian Army Recruitment :Know About Number of Youths Recruited from Different States https://web.archive.org/web/20220416111005/https://www.punekarnews.in/indian-army-recruitment-know-about-number-of-youths-recruited-from-different-states/
- Population numbers: Wikipedia


Leave a Reply